Data to create above chart is fetched from US FED Website. The API end point link on their website https://markets.newyorkfed.org/static/docs/markets-api.html
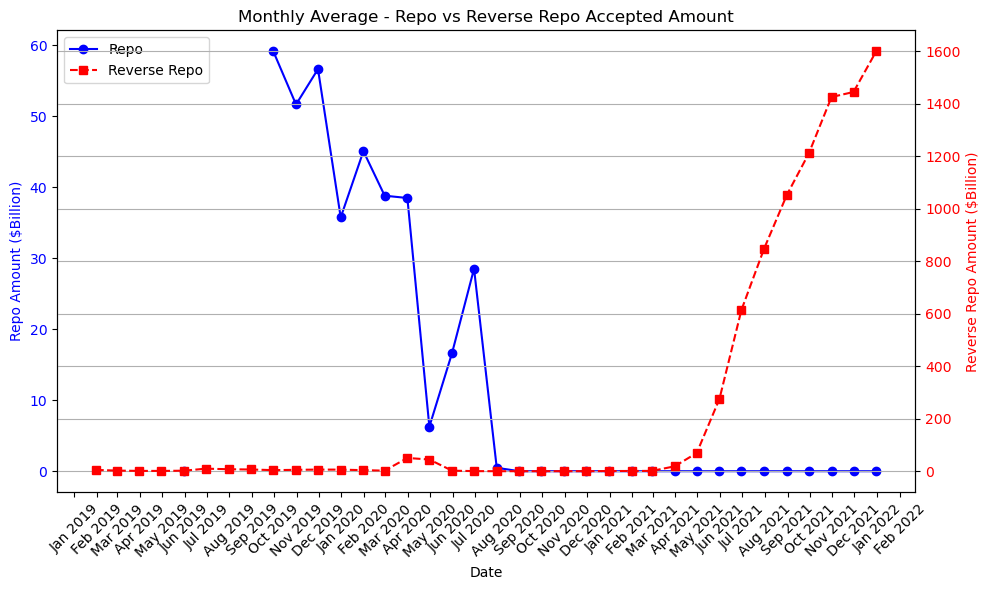
The above graph represent Repo and Reverse Repo Transaction Data between 2019 to 2022 (3 year period). It is represented on a monthly average basis.
REPO Surge in 2019
We can see the Repo market transactions (see the blue lines & left side of y axis) is subdued except for the period of September 2019 to July 2020. The spike majorly started in September 2019, when there was a sudden surge in demand in the Repo market. On September 17th 2019, the SOFR Rate suddenly surged to 5.25% from 2.43% in one day, even reaching an intraday high of 10% on the same day. What it really meant is suddenly, there was a huge demand for cash in the REPO Market on that day but there was no supply. This led to increase in SOFR rate i.e. risk free rate.
There are many explanation in the market for this spike:
A) The Repo Market has four major banks acting on the supply side of the REPO or act as lenders. They are JP Morgan, Bank of America, Wells Fargo and Citibank. All these banks decided not to lend as it was quarter end & they needed to have enough reserve shown in their own balance sheet.
B) There was redemption of a long dated Bond Settlement of $54 Billion and also a lot of liquidity demand for quarterly tax settlement. Due to both of these factors there was not enough supply of liquidity in the market.
C) There is another hypothesis going on, which is of a doomsday. That the Banks didn’t wanted to lend in the Repo Market despite it being a secured or collateralized lending. Reason being the Bank treated all the Collateral as unworthy and they don’t to lend against them. Despite being offered a high interest rates banks did not came forward to lend.
As a lender of last resort, FED Reserve chipped in and started to lend money in REPO market and brought situation into control by bringing in massive amount of liquidity.
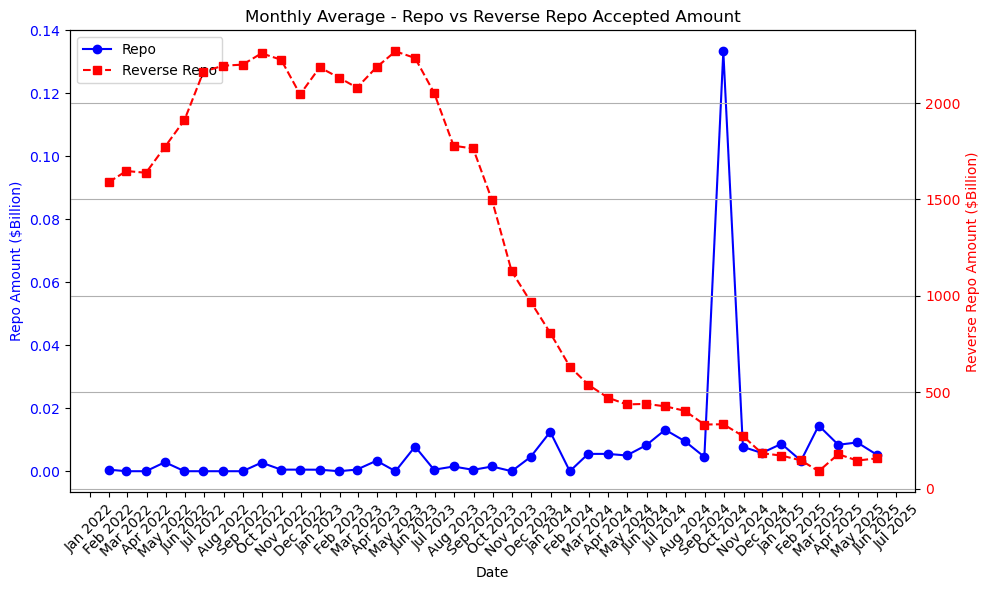
Rise and Fall of REVERSE REPO between 2021 and 2024
The above graph is for the period of Jan 2021 to May 2025. We can see the REPO market is now not active as much as it was in the period of 2019 to 2020. What’s interesting is the REVERSE REPO market started to rise from April 2021 and almost peaked at a whopping 2.5 Trillion US Dollars during the year 2023. This event of Reverse REPO market is not something which was observed in the past. While I tried to find the exact what really happened and what led to the huge demand for REVERSE REPO Market.
Below is some of the highlights why it happened:
1) Quantitative Tightening : After the huge Money supply during the COVID 19 by US FED, it started QT or quantitative tightening. It used the RRP or Reverse REPO to suck out a lot of cash from the economy.
2) There is also the theory of the FED using the Reverse Repo market to borrow money, so that it does need to issue further Bonds/Bills on a short term basis. By this means the FED can still borrow money without showing it in their book and pretend to still fight inflation and keeping its words.
3) The Demand for RRP or Reverse Repo starting to reduce when the large corporation started to pull their money out as the rates offered started to reduce. Also they started seeing investment opportunities else where instead of chasing risk free return from Treasury Securities.
This space is getting interesting and I will try and dig deeper into sometime later and would try to investigate what are greater implications of the same.
Conclusion:
i) Repo and Reverse Repo markets have become an active indicator of the plans of the US Federal Reserve. They can help gauge the health of the economy.
ii) Given the US Dollar is reserve currency of the global economy, maintaining enough liquidity and availability of USD is key to resilient and ordered financial system. Repo and Reverse Repo Market mechanism allows the Federal Reserve to effectively do the same
iii) One of the key reason for SEC to push for central clearing of US treasury and repo and reverse repo transaction is the size and importance of it in global financial system. Read the link for more on USTC rules and implementation https://www.dtcc.com/ustclearing
Links to access repo, reverse repo and SOFT rates from US Federal Reserve website:
SOFR: https://fred.stlouisfed.org/series/SOFR
Fed Fund Rate : https://fred.stlouisfed.org/series/FEDFUNDS
REPO: https://fred.stlouisfed.org/series/RPONTSYD
Reverse REPO: https://fred.stlouisfed.org/series/RRPONTSYD#

Leave a comment